Reading a retry storm: the same incident in three graphs
By Pavan Jegurupati, Founder, InferLearn
A previous post walked through the afternoon an evaluation agent turned one slow dependency into a thousand requests a minute. This one is the same incident, told through the graphs — because the reason it took twenty minutes to diagnose is that every graph we had was drawn to hide it.
The shape on the dashboard
Here is the request rate on the search service. Baseline sits around 140 a minute. At 14:05 it goes near-vertical, sits at the ceiling for six minutes, then drops off a cliff.
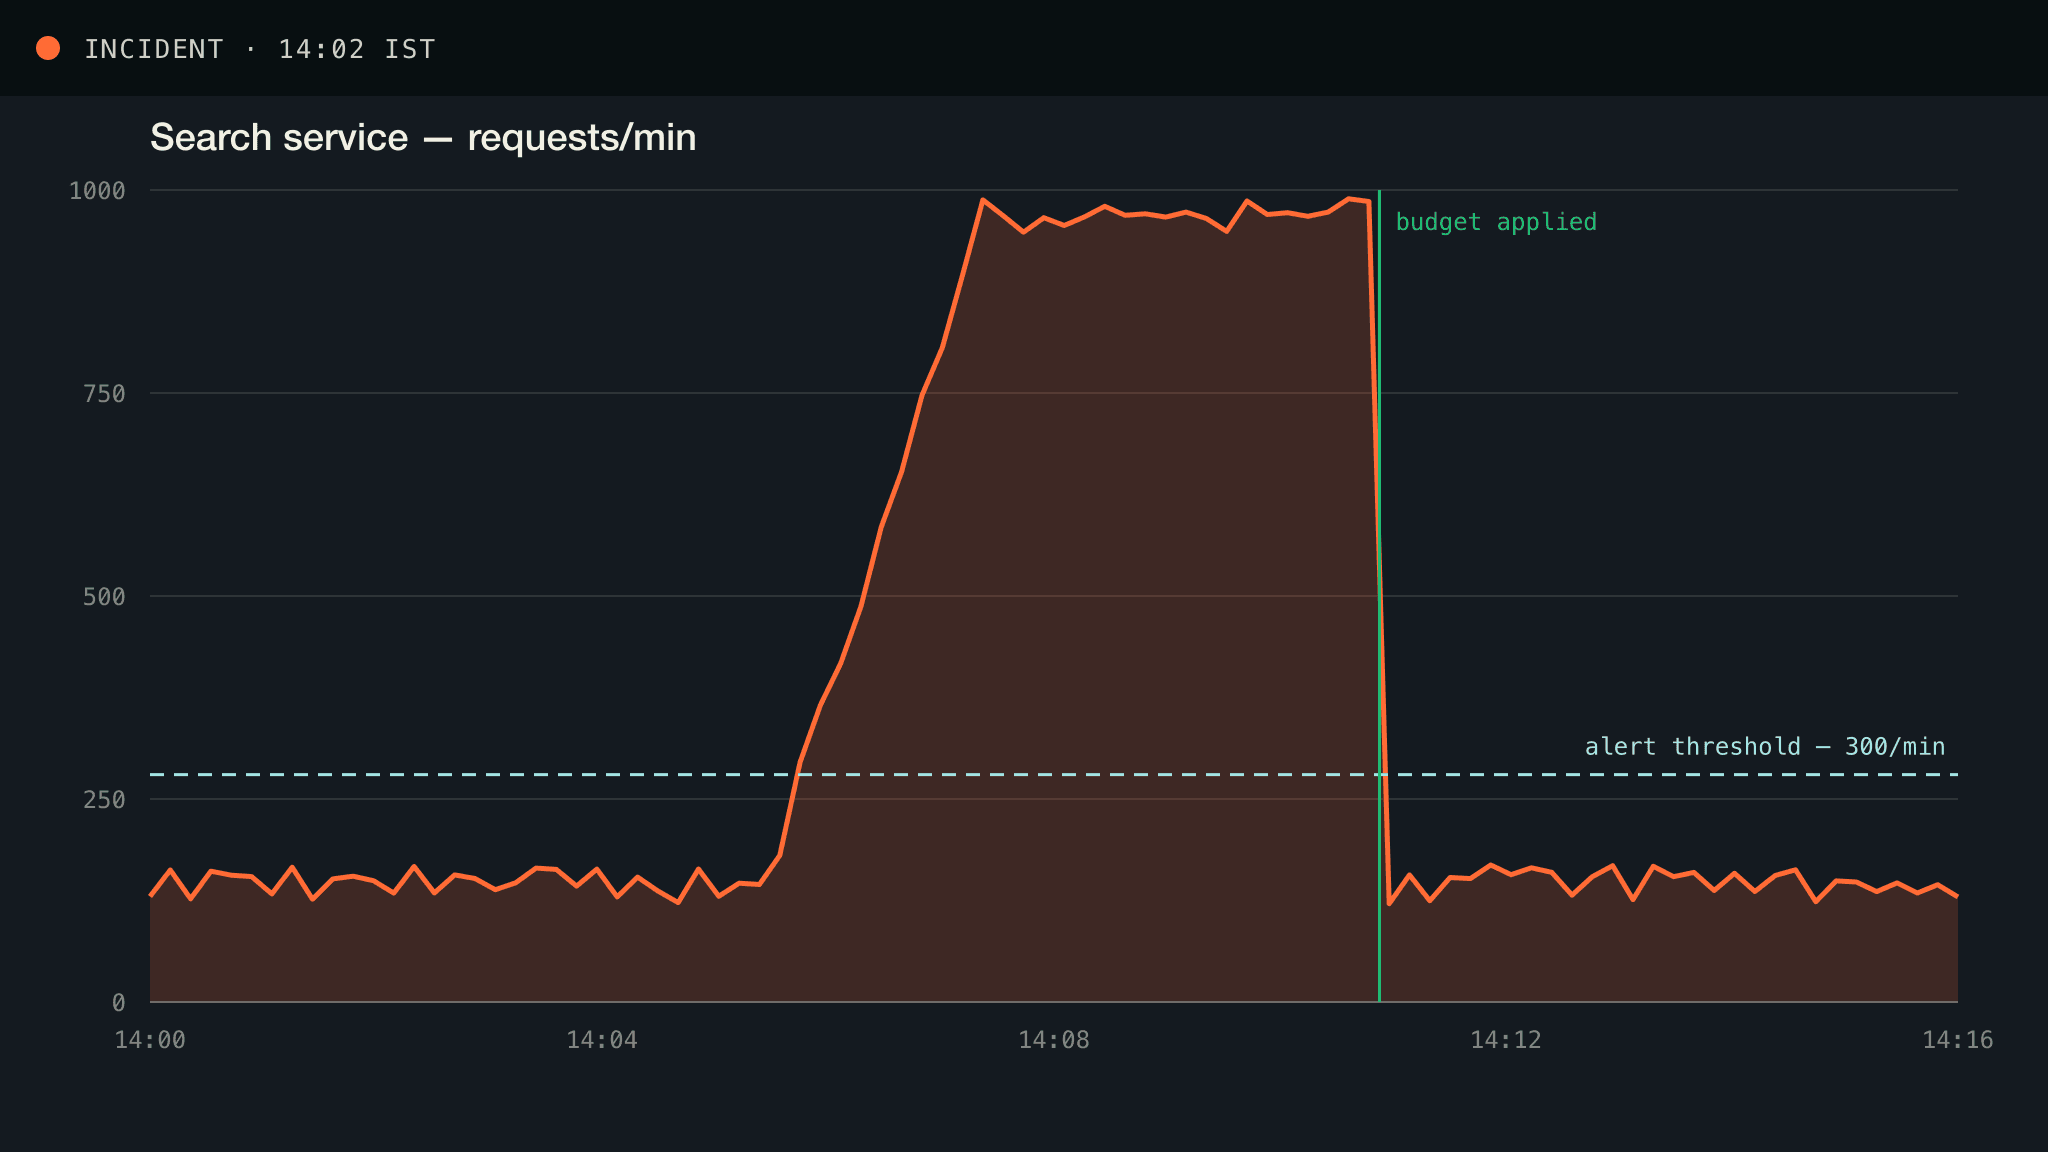
Every instinct says traffic spike. Scale up, ride it out. That instinct is what cost us the twenty minutes, because the graph is counting first attempts and retries as the same thing — and roughly 85% of that peak is the same handful of queries being asked over and over.
The fix is not a better alert. It is a second series. Split retries out and this graph stops looking like demand and starts looking like what it is.
Twelve minutes, end to end
Laid out on a timeline, the causal chain is short and entirely mechanical. Nothing failed. Every layer did exactly what it had been configured to do.
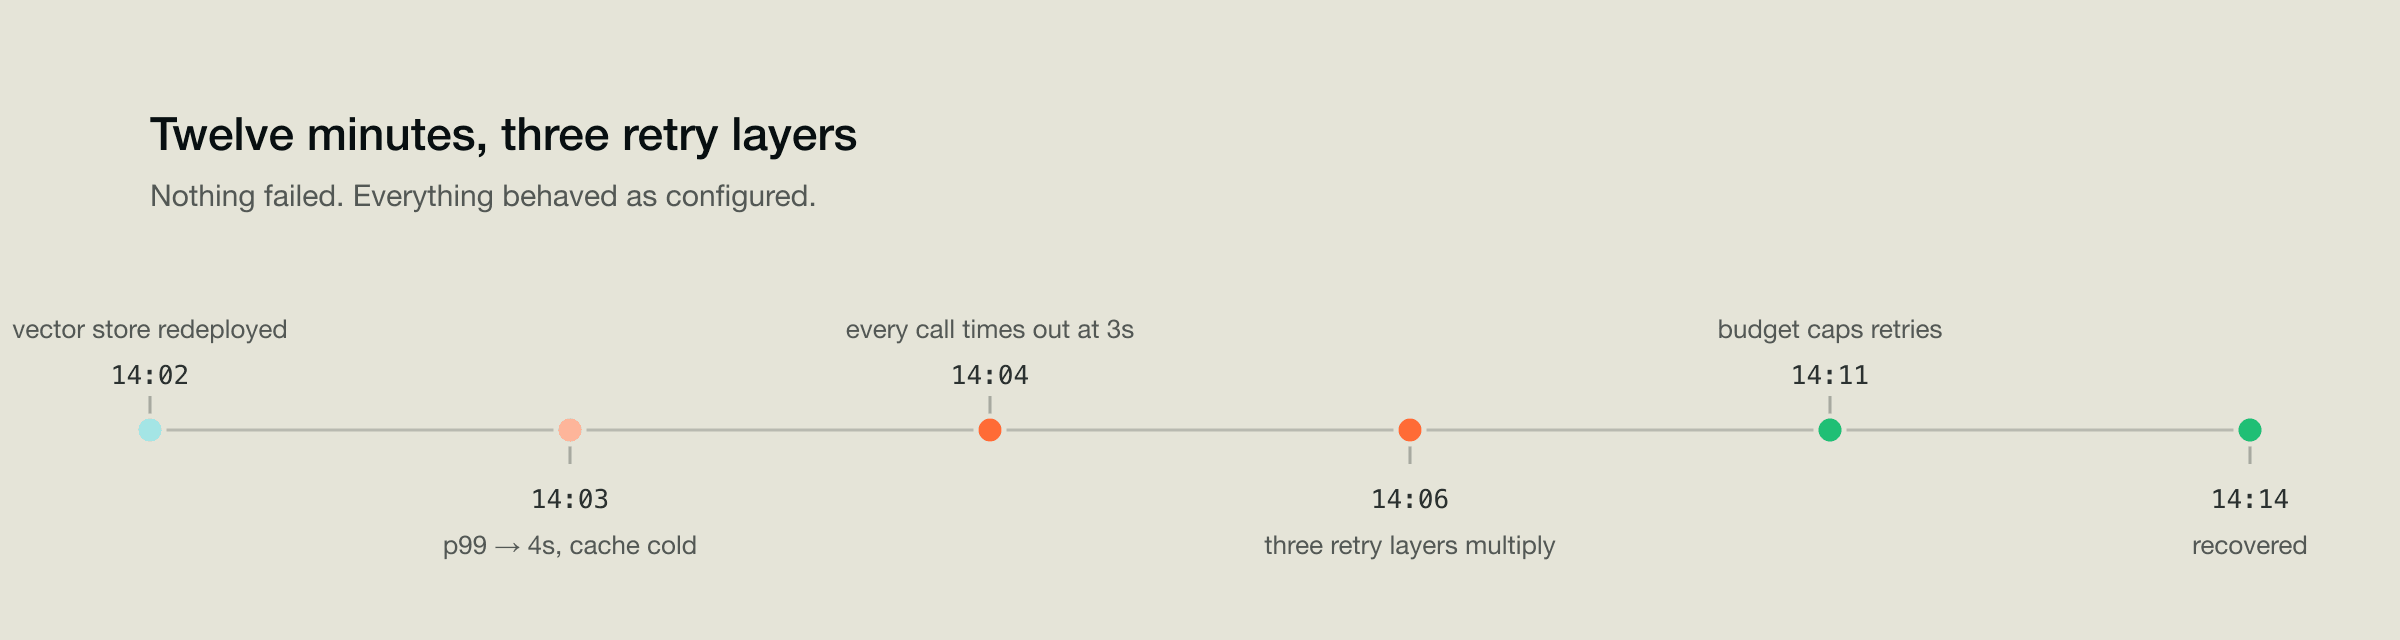
The gap between 14:04 and 14:06 is the whole lesson. A timeout shorter than the dependency's real p99 does not protect anything — it converts every slow call into a failed call, and every failed call into more calls.
What the budget actually does
A retry budget is the smallest change that breaks the loop, and the reason is that it is expressed as a share of successes rather than a count per call.
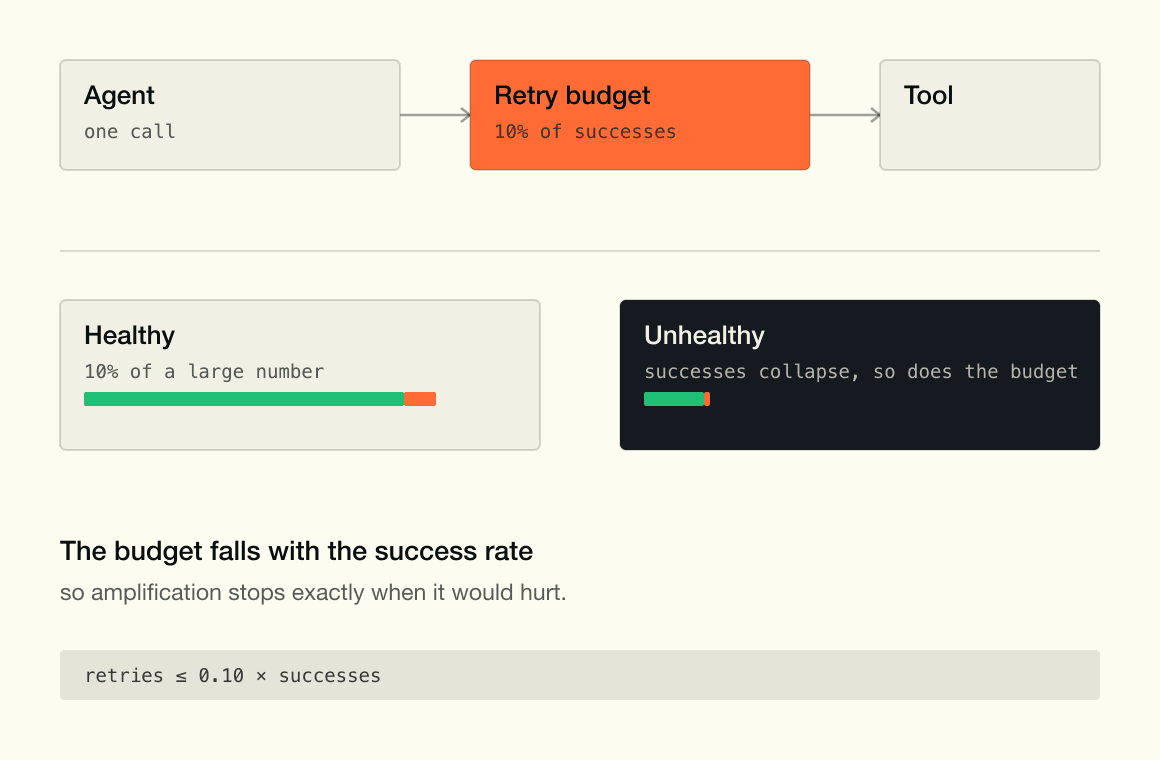
When the dependency is healthy, ten percent of a large number is more headroom than anything needs. When it is unhealthy, successes collapse — and the retry allowance collapses with them, automatically, without anyone paging anyone. The system stops amplifying at precisely the moment amplification would hurt.
What to put on the graph
Three series, and the incident reads itself:
- First attempts, alone. This is demand. Scale against this, never the total.
- Retries, as their own series. If this crosses your first-attempt line, you are not serving traffic, you are arguing with a dependency.
- Retry budget remaining, as a percentage. It falls before latency does, which makes it the earliest honest signal you have.
None of these need new instrumentation. They need the counter you already have, split by whether the call was an attempt or a repeat — which is one label.
Keep reading